Visualization Results of
Global Download Requests
for EROS Satellite Images
|
|
Jump
to: Motivation,
Example
Log File, To
Use Webportal, Acknowledgment
|
|
The
motivation of this project is
to develop a tool to visually
analyze the massive global download
requests for the satellite images
maintained by the Earth Resources
Observation and Science (EROS)
Center of U.S. Geological Survey
(USGS). In September 2008,
EROS annouced its new policy to
place all of their satellite imagery
in the public domain for free
download. Since then, a large
amount of spatial data contained
in satellite images is generated
every day and massive number of
satellite data download requests
have subsequently been processed.
Up to Mar. 2011, more than one million
requests have been processed and
the volume of these requests is
expected to increase steadily.
However, this data is not well
utilized by currently available
data visualization tools. Therefore,
this webportal has been designed
to visualize the properties of
global download requests for the
satellite images and analyze the
hidden download patterns.
This webportal provides easy access
to this data that can be viewed
as top results, downloaded
.kml files to be viewed with Google
Earth, or viewing the results
in the browser using the Google
Earth plug-in. Go to
the
Links section on this page
to find where to download these
scenes from EROS.
|
Below is a small sample of the
log file that is created when a
download request is made. This file
contains a lot of valuable data,
but it is not easy to see the most
requested scenes. This file includes
scene requested, satellite number,
row and path of the satellite, date
the scene was taken, and sensor
time.
PRODUCT_REQUEST_ID
LANDSAT_SCENE
WRS_PATH
WRS_ROW ACQ_DATE
SENS TIME_SENT_TO_LPGS
--------------------------------------------------------------------------------------------------------------------------------------------------------------------------------
9990809260001_00723
LE70360382005196EDC00
36
38
07/15/2005 ETM 01-OCT-2008
00:02:17
9990809260001_00721
LE70280302005220EDC00
28
30
08/08/2005 ETM 01-OCT-2008
00:02:17
9990809260001_00722
LE70290382005291EDC00
29
38
10/18/2005 ETM
01-OCT-2008 00:10:43
9990809260001_00724
LE70300322005250EDC00
30
32
09/07/2005 ETM 01-OCT-2008
00:10:43
9990809260001_00726
LE70440272005284EDC00 44
27
10/11/2005 ETM
01-OCT-2008 00:12:24
9990809260001_00725
LE70280292005188EDC00
28
29
07/07/2005 ETM
01-OCT-2008 00:14:27
0800809300295_00001
LE71670642000189EDC00 167
64
07/07/2000 ETM 01-OCT-2008
00:20:34
9990809260001_00727
LE70150352005225EDC00 15
35
08/13/2005 ETM 01-OCT-2008 00:26:36
0800809300296_00001
LE71400192007243PFS00
140
19
08/31/2007 ETM
01-OCT-2008 00:26:36
|
|
To make the visualization,
this data is loaded into a database
by a system administrator using
an Admin GUI. Once the log
file is added into the database
users of this webportal can query
the database to create .kml files
that can be viewed with Google Earth
or the the Google Earth plug-in.
|
Custom Query
To make a query
of the download requests navigate
to the "Generate Visualization Results"
tab on the top of this page. When
at the Query page select the desired
requirements. Once the desired choices
are made, select Submit Query. This
will bring up a download page that
will display useful statistical
results with the option to download
.kml files or to view the results
with the Google Earth plug-in.
Sample Query Result
Here is an example
of a custom user query:
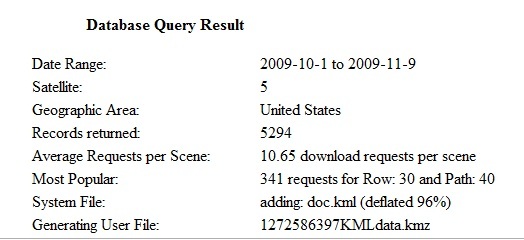
The row and path
numbers relate to the global mapping
scheme used by EROS to designate
geographic locations relative
to the position of the Landsat
satellites that record the images.
Every row/path combination maps
to a unique Latitude/Longitude
centered position on the earth.
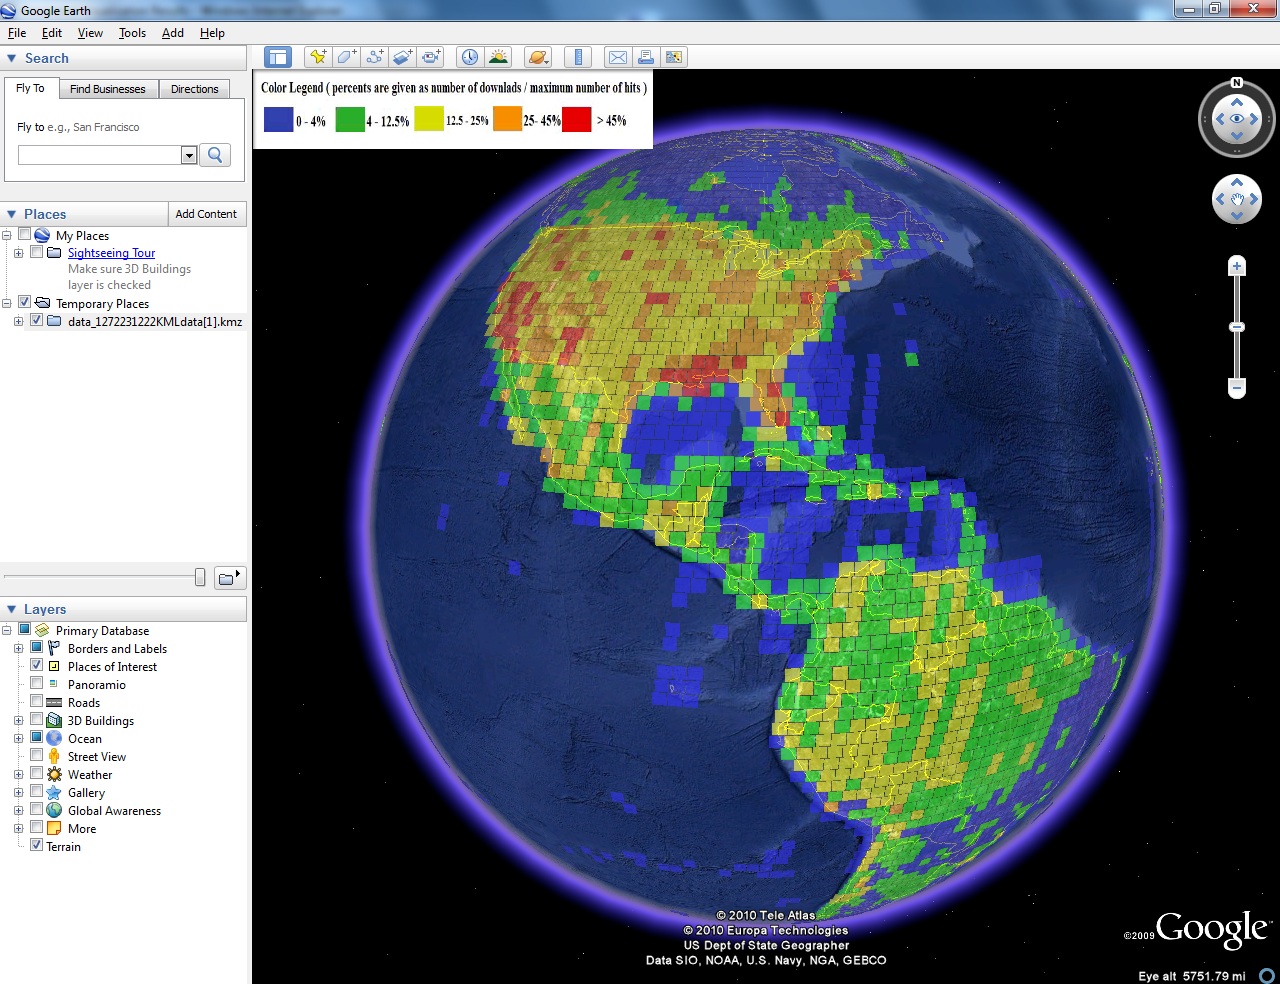
Google Earth Plug-in
The results of the
user-defined query can be viewed
within the web browser by selecting
the "View via Google Earth Plug-in"
button at the bottom of the query
results page. This currently only
works for Windows users, and a download
link for the browser plug-in will
be provided if necessary. WARNING:
Use of the browser plug-in is very
graphics intensive and will result
in sluggish response on machines
with marginal graphics resources.
Pre-generated Visualization
Data
A table of pre-generated KML files
is accessible from a table by selecting
the "Pre-Generated Visualization
Results" button at the top of any
page on the site. The table is organized
by year and month, and the number
of download requests for each month
are displayed above each link. Several
months display "No Data" because
download requests for months prior
to October 2008 (the release of
satellite imagery to the public
domain) were not analyzed, and data
is not yet available for the later
months.
|
We greatly appreciate the generous
support from the Computer and Network
Systems (CNS) Program of the National
Science Foundation (NSF) under the
Grants No. 0915762 and 1212535
as well as the Nelson Research Grant. We are also thankful
to EROS for providing the global
download requests data.
|